Analyses
This feature allows you to create, edit details, duplicate, delete, or share analyses. You can customize new workbooks with selected data (Genes and miRNAs, Variables, Cohorts) and the following plot types:
Bar Chart
Histogram
Scatter Plot
Violin Plot
Cubby Hole Plot
SeqPeek
OncoPrint
OncoGrid
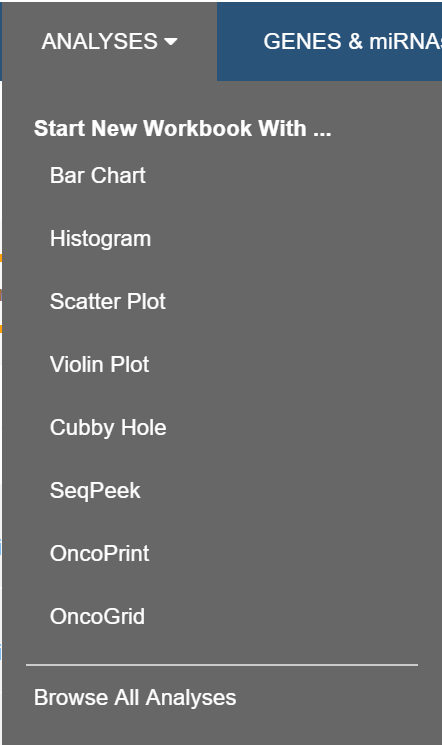
Start New Workbook With…<Plot Type>
Selecting Start New Workbook With and one of the above plot types from the Analyses menu dropdown displays a screen which enables you to create, edit details, duplicate, delete, or share analyses.
This is the same screen that is displayed when you choose to create a workbook using the Create a New Workbook link from Your Dashboard or the WORKBOOK menu, except that the Analysis Type field is prepopulated with your selected plot type.
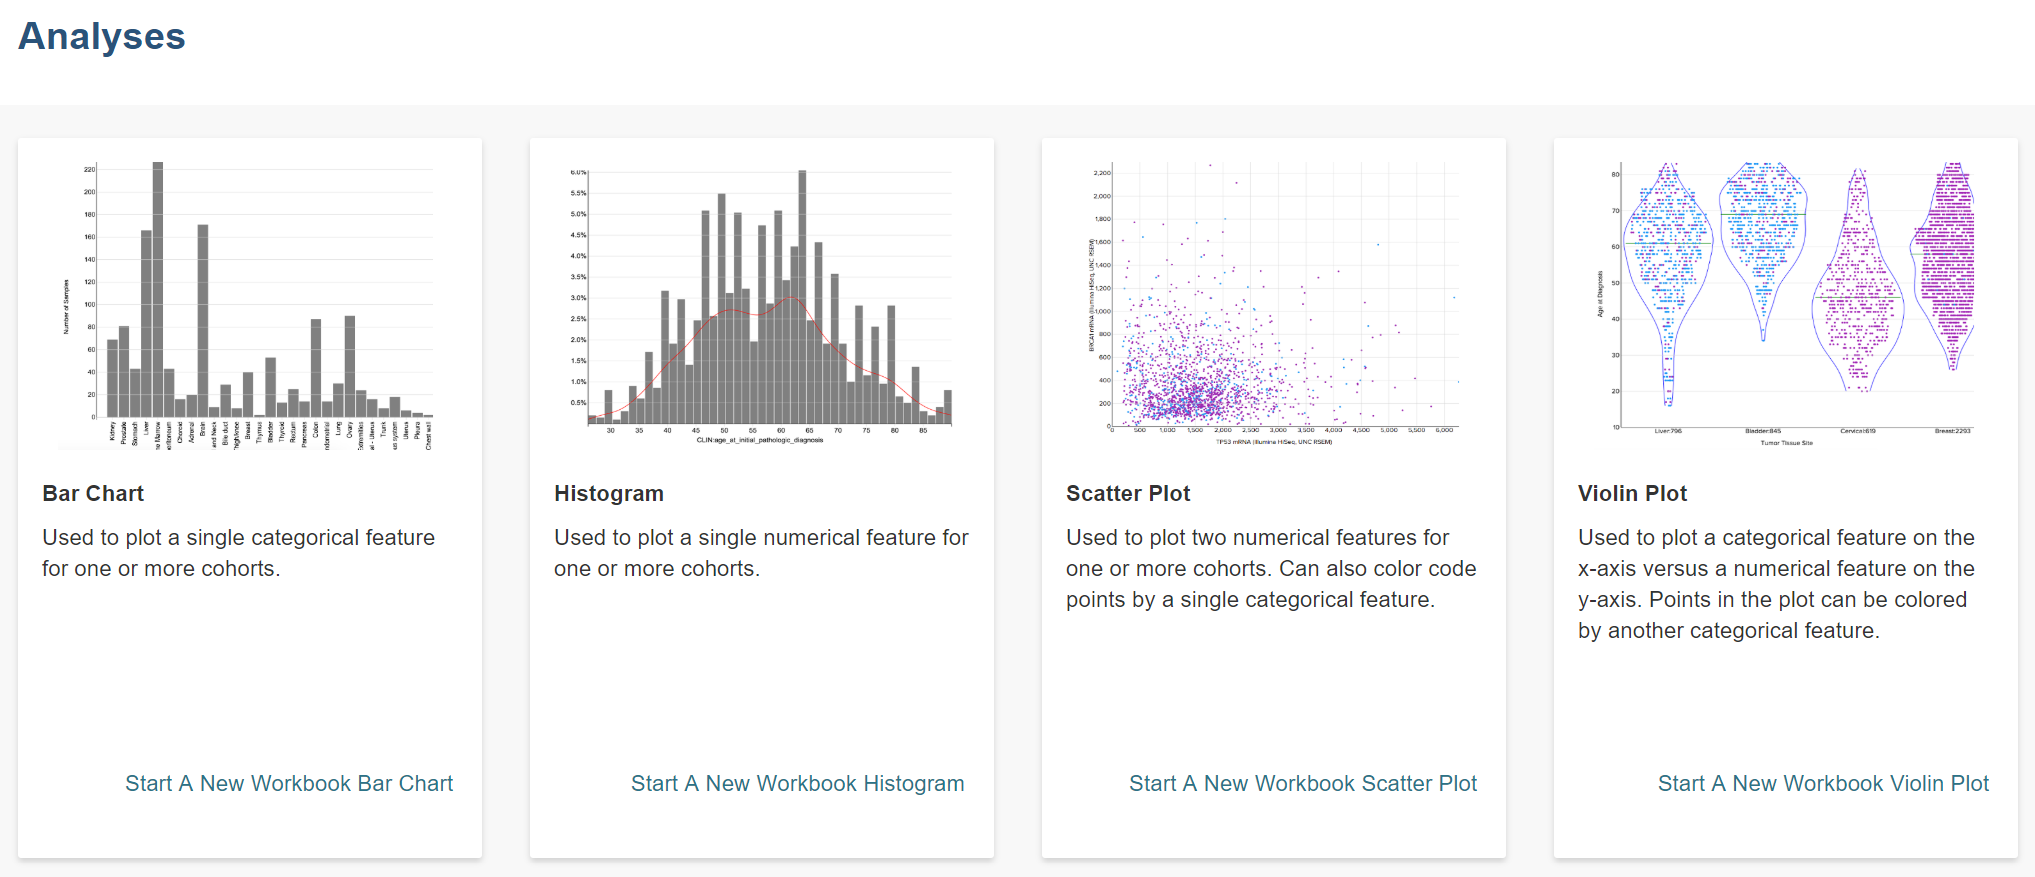
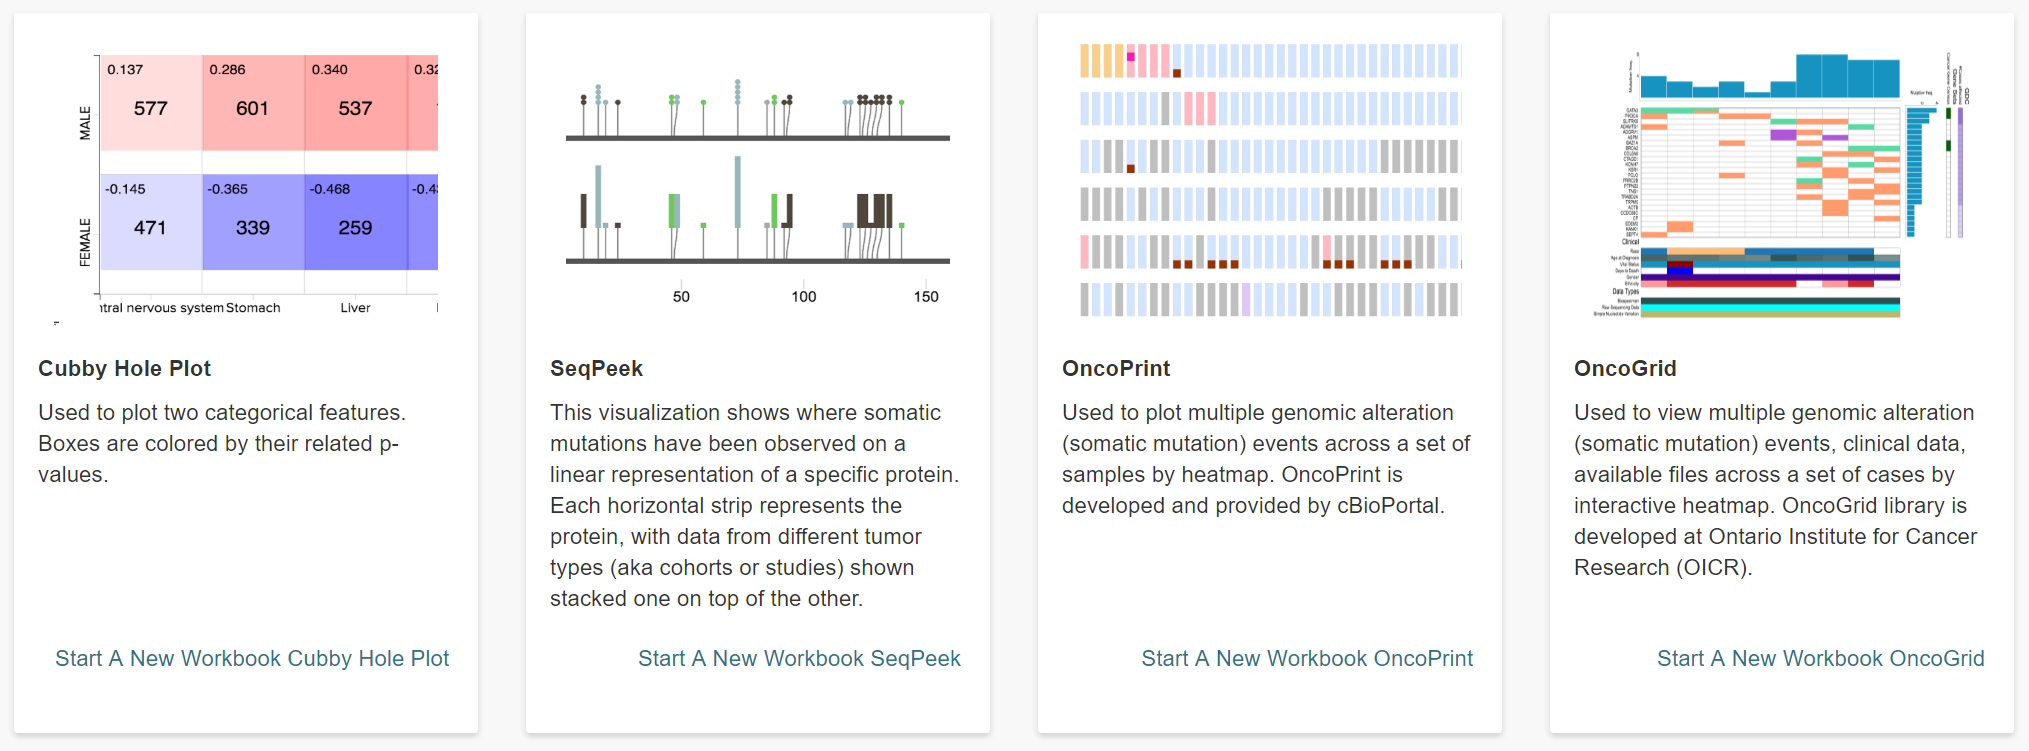
Browse All Analyses
Selecting Browse All Analyses from the Analyses menu dropdown displays a screen which provides a visual example and a written description of each type of plot. This information can help you determine which type of plot would be useful in your analysis.
From here, click on the Start a New Workbook <Plot Type> link to go to a screen which enables you to build your analysis.